
The P-20 Network – Who we are collectively – June 2020
At the historic and unusual end of the 2019-2020 academic year, the P-20 Network decided to collect a small amount of demographic data and analyze the make-up of the Network based on who its students are as reported publicly via the Illinois Report Card and Illinois Postsecondary Profiles websites. This data is based on the numbers reported on those websites on June 30, 2020, which, to a large degree, is data from the previous school year (a year old). Nevertheless, it paints a relatively accurate picture of who makes up the P-20 Network. For this analysis, only data from school districts and postsecondary institutions from across the Network was studied as including the state agencies or other statewide organizations would naturally include all students and organizations across Illinois.
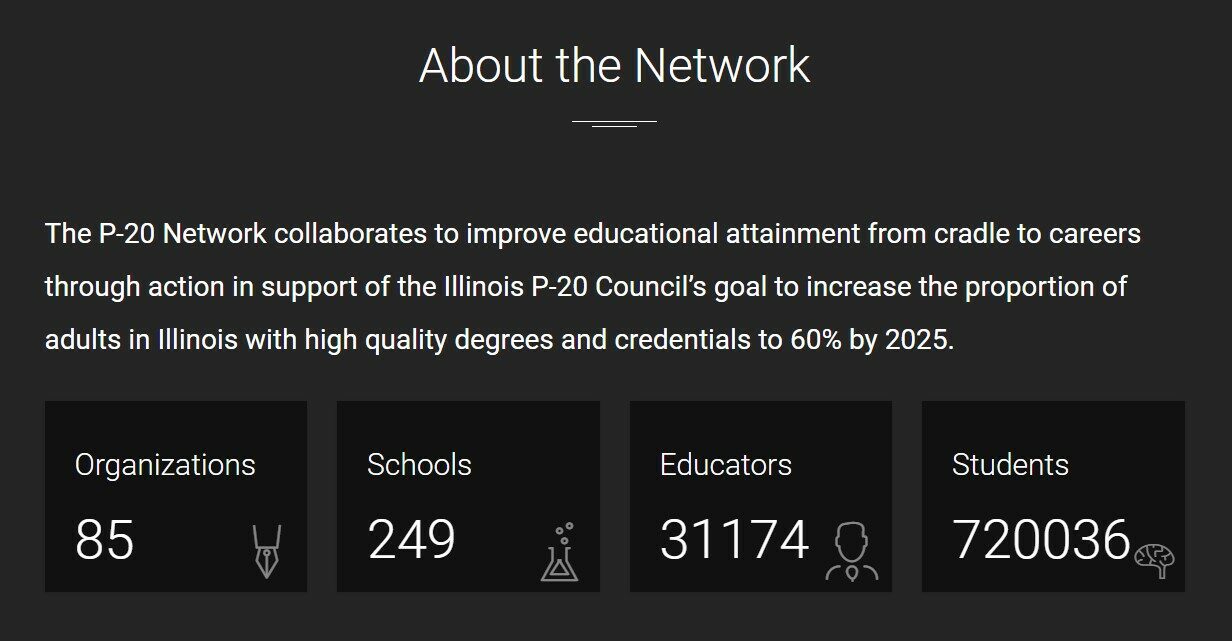
Overall, the P-20 Network currently includes organizations that serve over 700,000 students, and approximately half of them are served in school districts and half of them are served in postsecondary institutions.
Elementary & Secondary Students
Across the school districts that are engaged with the P-20 Network, there are 366,810 students. In general, the demographics of the P-20 Network mirror the State of Illinois with a few key differences.
| Student Demographic | P-20 Network (%) | State (%) |
| Low Income | 38 | 49 |
| Students with IEPs | 15 | 16 |
| Homeless Students | 2 | 2 |
| Students learning English | 13 | 12 |
| White Students | 49.4 | 47.6 |
| Black Students | 8.4 | 16.7 |
| Hispanic Students | 28.4 | 26.4 |
| Asian Students | 9.4 | 5.1 |
| American Indian Students | 0.3 | 0.3 |
| Pacific Islander Students | 0.1 | 0.1 |
| Students of 2 or more races | 4.0 | 3.8 |
The school districts that participate in the P-20 Network have an overall lower percentage of low income students (38%) than Illinois does statewide (49%) and a lower percentage of students whose families identify as Black (8.4%) than does Illinois (16.7%). There is also a higher percentage of students whose families identify as Asian across the P-20 Network school districts (9.4%) than there is across the entire state (5.1%). Not represented by this data is the fact that the school districts that currently make up the P-20 Network also represent a wide variety of communities, from smaller (in population), rural farming communities to urban centers to a wide range of suburban communities featuring many different types of housing and commercial areas. The range of careers that make up the communities represented across the P-20 Network is arguably as diverse as anywhere in the United States.
Despite these differences, the general diversity of students across Illinois is represented by the school districts across the P-20 Network, and regardless of comparisons, the students being served across these school districts represent a wide variety of backgrounds and experiences.
Postsecondary Students
As a result of the efforts of the Illinois Community College Board, the Illinois Board of Higher Education, and the Illinois Student Assistance Commission, the Illinois Postsecondary Profiles website offers a wealth of data about students in higher education in Illinois. This data is not aggregated statewide like it is in the Illinois Report Card, and there is not data included about how old students are or what their pathways to their current postsecondary experiences are. (For example, the question how many current community college students already have a Bachelor’s Degree? is not answered by this data.) Nevertheless, there are some important data points we can begin to track across the P-20 Network.
| Student Demographic | P-20 Network (%) |
| Full-Time Students | 41 |
| Part-Time Students | 59 |
| White Students | 48 |
| Black Students | 11 |
| Hispanic Students | 25 |
| Asian Students | 7 |
From even this brief data set, there are a number of important points for analysis. First, the percentages of full-time versus part-time students has significant implications for instruction, schooling, and supports. Most of the postsecondary institutions in the P-20 Network are community colleges (20 of the 25 postsecondary institutions), and the high number of part-time students is not new or uncommon in community colleges. Nevertheless, it is important information for programming and supports and ensuring advancement and degree completion. With regards to the race/ethnicity data points, the enrollment of postsecondary students across P-20 Network institutions closely reflects the demographic characteristics of the population of elementary and secondary students with Black students being underrepresented in postsecondary institutions in comparison to the percentage of the current K-12 student population statewide and with Asian students being represented at a higher percentage in postsecondary institutions than they are in the current K-12 student population statewide.
Overall, the P-20 Network is very diverse, and educational successes across the P-20 Network are successes that can likely be replicated across Illinois, the United States, and beyond.
Thank you to P-20 Network Graduate Research Assistant Sadia Qamar for the data collection and methodology work done that served as the foundation for this analysis.